It is difficult to achieve effective farming without a knowledge of accurate area and location of each field. It is hard to overestimate the value of up-to date high resolution aerial imager. It brings information about crop health, soil conditions and even the current state of drainage tile system to the table. Our cutting edge technologies will provide you with vital data for efficient decision making, reducing expenses and raising yields.
Land inventory and surveying
Actual size data for every field is the key for successful costs management. Every miscounted hectare leads to erroneous seeds, fertilizers, pesticides and fuel cost assessment. This will also end up with inaccurate yield estimation. Aerial surveying with UAV is much more productive than traditional land observations. You can obtain thousands of hectares of highly accurate imagery of your fields per day, just at a fraction of a manned services cost. Our UAV systems provide images with spatial resolution better than a satellite can offer. You will always get great results despite any cloud cover. The level of image detalization (fine image quality) allows detection of accurate fields shape and area, real land use and land cover, crop types and patterns, erosion, tillage issues and even plant height.
Reclamation planning
Using Geoscan technologies you can take advantage of high-resolution orthophotos, raster and TIN surface models. These data help our clients reveal dry and soggy areas, create soil moisture maps and plan irrigation procedures. Every Geoscan suit for agriculture comes with 3D GIS software Sputnik. It gives you convenient tools for accurate measurements of volumes, profiles, distances and areas. For instance, you can in few minutes determine the amount of earthworks for paddy fields construction or maintenance. Wide choice of export formats allows advanced 3D modelling in CAD software and deep spatial analysis in GIS.
Capture Up to 8000 hectares (19 000 Acres) per day
Crop health monitoring
NDVI maps along with high resolution RGB images are a great source of valuable information about the current crop health situation. Vegetation index maps are also often used for identification of homogeneous fertility zones. These data help to create prescriptions for planting, chemical treating, watering and fertilizing. Knowing the location of homogeneous fertility zones, you will be able optimize soil sampling for physical or chemical content and pest issues. Taking samples at specific points of interest, instead of regular grid, decreases the number of pieces and reduces the impact of random factors on analysis results.
Using GIS Sputnik, you can create and visualize NDVI maps, calculate histograms for particular areas and perform classification with simultaneous vectorization. Export to CSV, txt and shapefile formats is available.
Take advantage of NDVI – a powerful tool for crop health assessment and management
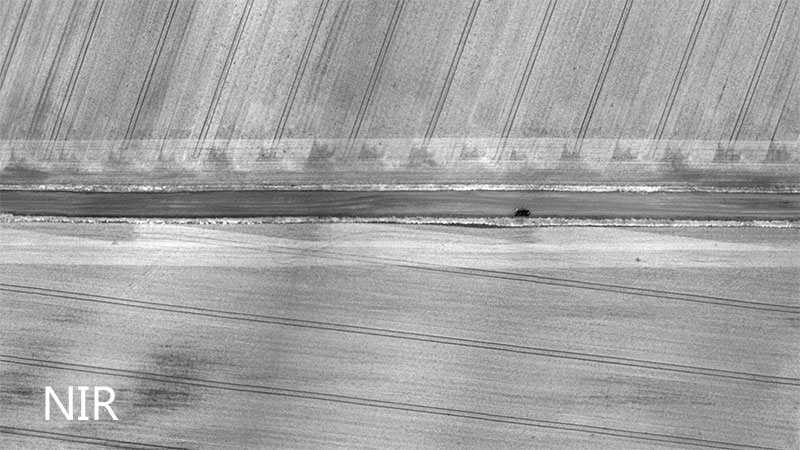
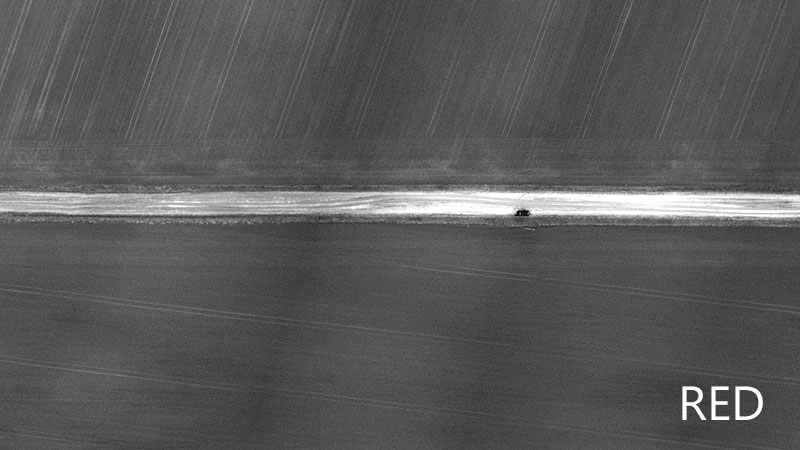
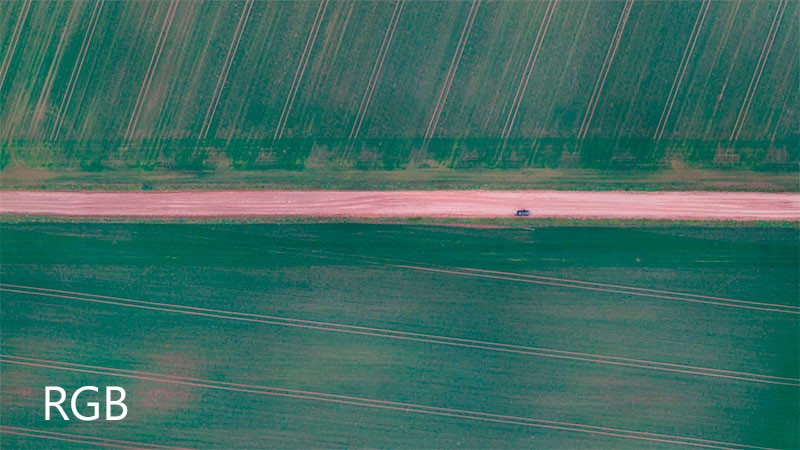
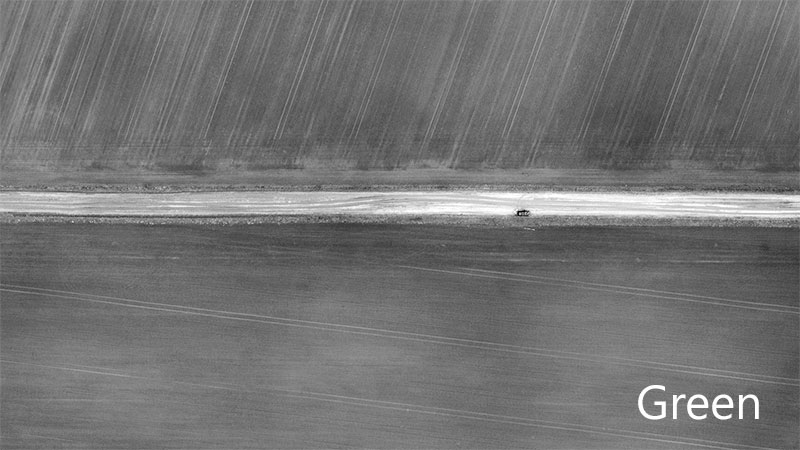
Crop status analysis by vegetation indices is based on the principle that plant tissue highly reflects radiation in near infrared (NIR), while chlorophyll absorbs light in red range (RED). Thus, pictures of the plants look much brighter in infrared range than in red range. This is clearly illustrated on the image below:


The NIR picture reveals increased seedling density on the edge of the field ("sawtooth" along the road). The reason of that increase is the additional seeder track along the field contour, which leads to a double sowing. One can even distinguish a place where the seeder stopped.
After a careful look at the color image one can also notice more dense areas along the road, and it may seem like the vegetation should reflect in green range as high as in NIR. Actually, this is not true: pay attention to the image in the green channel: the reflective characteristics of the vegetation are differ from the soil much less than in infrared range.


Real time supervision of agricultural activities
UAVs from Geoscan can be equipped with optional payload for real time video monitoring. This is very useful for harvest control, machinery supervision and unauthorized loads prevention.
Agricultural insurance
Our technology allows accurate overall crop state assessment throughout the season. Detailed 3D models provide reliable volume measurements, for example of sugar beets or wheat open piles. Such data will help you with insurance costs estimation, risk management and damage assessment in case of insured event.