A. V. Makarov, M. V. Kurkov, A. A. Barymova
The sea coast is a border strip between land and sea, characterized by the spread of modern and ancient coastal landforms... (According to I. S. Shchukin) [1]. All components of the sea coast are interconnected, therefore, "... the coast, in in the broadest sense of the word, can be considered as a complex natural system with interconnections. For them, the existence of self-regulation processes and the presence of reactions to external influences is typical" [2].
The coastal strip of the White Sea is a zone of active movement of stones, sand, silty soils in the process of rock destruction, water transport and fine sediment. These abrasion and accumulation processes constantly change the shape of the coastline. The presence of high and low tides determines the structure of the coastal strip, which includes the littoral zone (bottom zone covered with water at high tide), sublittoral zone (bottom zone that starts from the maximum low tide and continues in depth to the conditional boundary of vegetation distribution) and supralittoral zone (coastal zone that starts from the upper boundary of the tide and continues up to the level of the maximum storm surge) [3]. In winter, there is a factor of ice transport of soil and stones [4]. In these zones, there are special plant and animal communities that adapt to changing conditions. In this regard, the coastal strip of the White Sea is an extremely interesting testing ground for developing methods for the integrated study of coastal shallow waters of the Arctic seas.
1. Features of comprehensive studies of coastal shallow waters and coastal strip
These days, comprehensive studies of Arctic shallow waters are being actively developed. Prompt receipt of reliable information on the state of coastal ecosystems is necessary to rationally plan the development and minimization of anthropogenic impact on the ecosystems of the Arctic shelf during geological surveys and the exploration of minerals, especially in the extraction of oil and gas under water, during the transportation of minerals, the laying of communications and the construction of facilities coastal infrastructure.
Comprehensive marine research in the Arctic is carried out to create the most complete picture of the current state of the sea shelf and coastal strip, which can be obtained using the cutting-edge methods and equipment. Comprehensive studies include the study of sediments on the seabed, the state and composition of the water column, living organisms, the state of marine and coastal ecosystems.
Integrated marine research combines geophysical (seismoacoustic and sonar), biological, hydrological, geological and geomorphological methods. An important component of comprehensive research is remote sensing data. Among them are satellite and aerial images. They help to study the ice situation in the Arctic, pollution of the water surface and coasts with oil products, changes in the shape of the coastline, the state of the soil and vegetation cover, etc. High-resolution satellite images, on which objects less than 1 m in diameter are distinguishable (that is, less than 1 m2 of the earth's surface per pixel of the imaging equipment matrix) make it possible to map the rookeries of marine mammals on the Arctic coasts, track the position of ships, and receive operational information in emergency situations.
2. Brief review of high-resolution remote sensing data sources
High-resolution optical systems are installed on low-orbit satellites (orbit height is from 440 to 770 km). Nowadays, images of the following satellites are available for commercial use (Table 1).
| Country of production | Satellite‘s name |
| Constellation DigitalGlobe (USA) | QUICKBIRD |
| WORLDVIEW-1 | |
| WORLDVIEW-2 | |
| WORLDVIEW-3 | |
| Constellation GeoEye (USA) | IKONOS |
| GEOEYE-1 | |
| GEOEYE-2 | |
| Constellation IRS (India) | CARTOSAT-2, 2B |
| Constellation PLEIADES (France) | PLEIADES-1A, 1B |
| Japan | ALOS-3 |
| Israel | EROS B |
| Korea | KOMPSAT-2 |
| KOMPSAT-3 | |
| Russia | RESURS-P |
Table 1. Satellites with high resolution optical equipment
As an example, let‘s consider the characteristics of two satellite systems: Pleiades, a constellation of two satellites put in operation in 2012, and the latest World View-3, launched in 2014.
In order to study the coastal strip of the Arctic seas, the following satellite characteristics are of the greatest importance.
Pleiades, like many other high-resolution optical devices, has equipment capturing in three bands of the visible spectrum - blue, green, red, in NIR (these are multispectral bands) and panchromatic band that combines the entire visible spectrum. A feature of satellite imaging is that the resolution of the panchromatic band is always higher than that of multispectral imaging. For Pleiades satellites, the actual GSD of multispectral images is 2.8 m while the panchromatic band is 0.7 m. The survey bandwidth is 20 km. Multispectral bands in various combinations make it possible to analyze the state of forests, agricultural lands, and anthropogenic landscapes. It is the presence of equipment capturing in NIR that makes it possible to analyze the state of green spaces, since the chlorophyll contained in higher plants does not absorb infrared radiation, but reflects it. Panchromatic band with 0.7 m GSD allows you to make accurate maps.
The World View-3 satellite, unlike Pleiades and all other high-resolution satellites, captures in three multispectral modes: VNIR (Visible and Near IR, 8 bands), SWIR (Shortwave Infrared, which allows you to capture through haze, fog, smog, dust, smoke and clouds — 8 channels), and CAVIS (stands for clouds, aerosols, vapors, ice, snow — allows for atmospheric correction, 12 channels). The GSD of this device is the highest among civil satellites. Panchromatic images have a 31 cm GSD, multispectral images — 1.24 m, SWIR — 3.72 m, CAVIS — 30 m. The survey strip width is 13.1 km. This device performs all the tasks that are assigned to high-resolution satellites, but much more accurately and in detail. Including with its help, topographic maps and digital elevation models with an accuracy of 1-3 m in height are created. The predecessor of this satellite, World View-2, has slightly lower resolution equipment. Panchromatic channel — 46 cm, multispectral — 1.84 m. [5].
When studying Arctic shallow waters and coastal areas, high-resolution satellite data can distinguish objects up to half a meter across, such as separate boulders. Such images make it possible to analyze the state of the coastal strip of water bodies (for example, the presence of storm emissions), to roughly assess the mechanical composition of open ground (silty, rocky soils), to distribute plant communities (seaside meadows, reed beds, wetlands — seaside, saline peatlands, bunches of halophytes — salty plants, thickets of sea grasses, such as zostera) (Pic. 1).
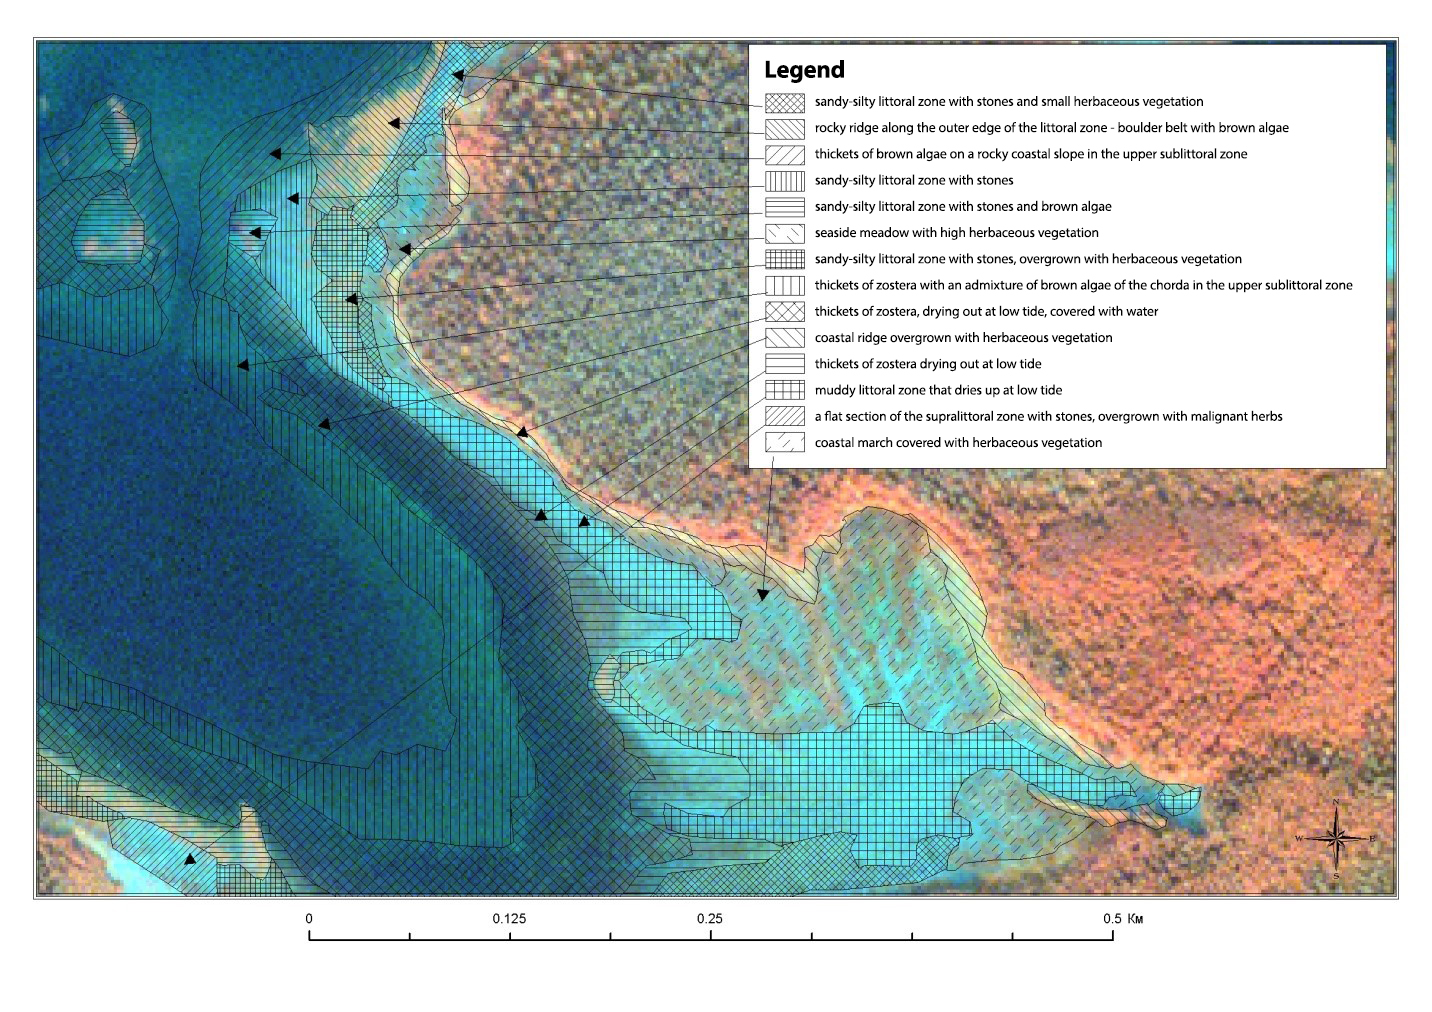
Pic. 1. Fragment of a WorldView-2 satellite image with a NIR channel, which shows coastal areas with various soils and plant communities
On high-resolution satellite images, it is possible
- remotely highlight the boundaries of forests and open spaces;
- distinguish coniferous and deciduous trees, as well as the boundaries of allotments and fallouts of a forest stand;
- separate swamps and meadow herbaceous vegetation; bedrock outcrops and accumulative sandy beaches; traces of anthropogenic impact, any buildings, roads, paths and ruts in the ground.
After processing the satellite image in specialized programs, it is possible to more clearly distinguish objects or their groups by changing the display intensity of various spectral bands or by creating different combinations of them. So, this allows
- detecting accumulations of algae in a coastal strip of the seas as well as dense thickets of aquatic plant species in shallow waters;
- on the shore, assessing the state of forest plantations, the spread of tree diseases in forests;
- identifying areas with increased moisture, flooded areas, oil pollution and evaluate the areas of windblows.
One of the main tasks of high-resolution satellite imagery is the implementation of detailed, long-term monitoring, tracking changes in the terrain in a variety of parameters.
3. Comparison of methods for obtaining and using remote sensing data from satellites and aerial photography from a quadcopter
The paper considers the use of quadcopters for aerial photography manufactured by Geoscan Group (hereinafter referred to as Geoscan). The Geoscan 401 quadcopters are equipped with Sony Cyber-shot DSC-RX1 cameras and can perform high-quality aerial photography with 4 cm GSD and higher. These days, UAVs of this class are used for cadastral work, monitoring agricultural lands, forest areas, mapping anthropogenic landscapes, in design and construction, for assessing the situation in emergency situations (floods, fires), etc. To obtain specialized information, UAVs are equipped with cameras operating in the IR range.
Comparison of high-resolution satellite imagery and aerial photography from UAVs was carried out according to several parameters.
a. GSD
The panchromatic band of the WorldView-3 satellite has a resolution of 31x31cm GSD. This is by far the highest GSD of satellite imagery available for civil commercial use. This band combines the entire visible spectrum and is used to build detailed maps and detail multispectral images. As an example, a panchromatic image of the WorldView-2 apparatus with a spatial resolution of 46x46 cm, which was used in the study of the White Sea coastal strip (Pic. 2), is given.
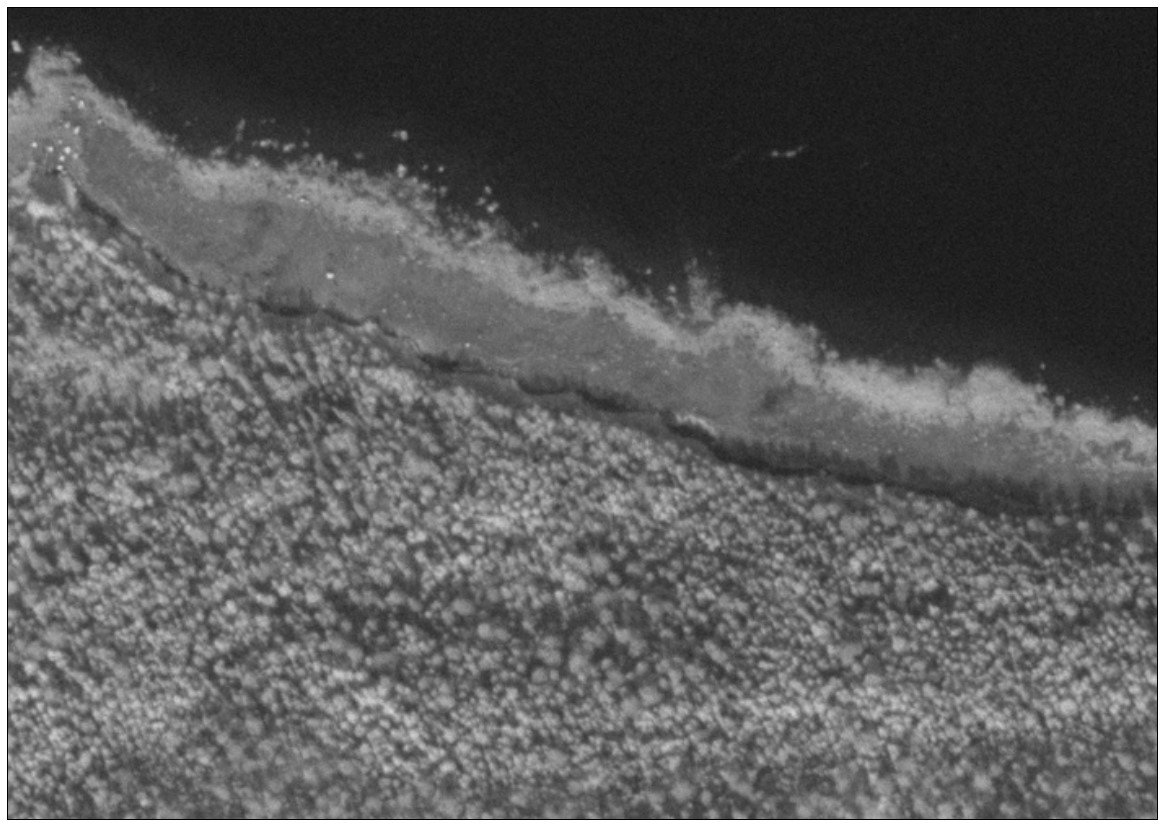
Рic. 2. Part of the image of the White Sea coast in the panchromatic band from the WorldView-2 satellite. In the upper part of the image, there is water surface of the sea, in the middle part — the littoral zone, in the lower part — the forest.
The combination of bands of the multispectral range, in which the IR is present, makes it possible to distinguish various types of plant communities, in particular, dense thickets of brown algae Fucus vesiculosus and Fucus serratus at the lower boundary of the littoral zone (Pic. 3).
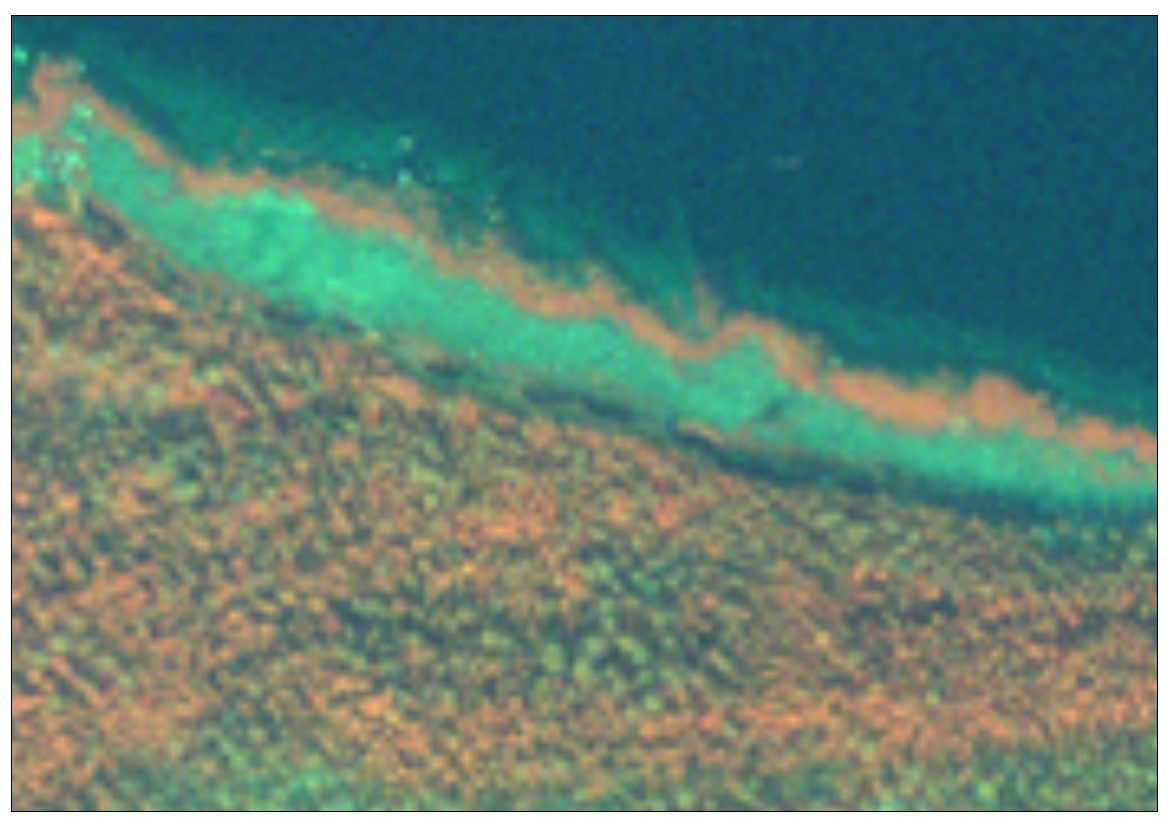
Рic. 3. Part of a multispectral image of the White Sea coast from the WorldView-2 satellite. In the middle part of the image, thickets of brown algae stand out as a bright red stripe.
The aerial photography by Geoscan 401was carried out at the altitude of 60 m and with 1 cm GSD. When using a high-class geodetic receiver on board and base stations on the ground, it is possible to provide a binding accuracy of up to 10 cm. Since these images are taken in the visible spectrum and displayed colored, then they clearly distinguish plant communities, the mechanical composition of the soil surface (rocks, stones, earth and peat, sand and silty soil). Separate objects such as tree trunks, buildings and vehicles are clearly visible. It is possible to distinguish power line pylons and wires.
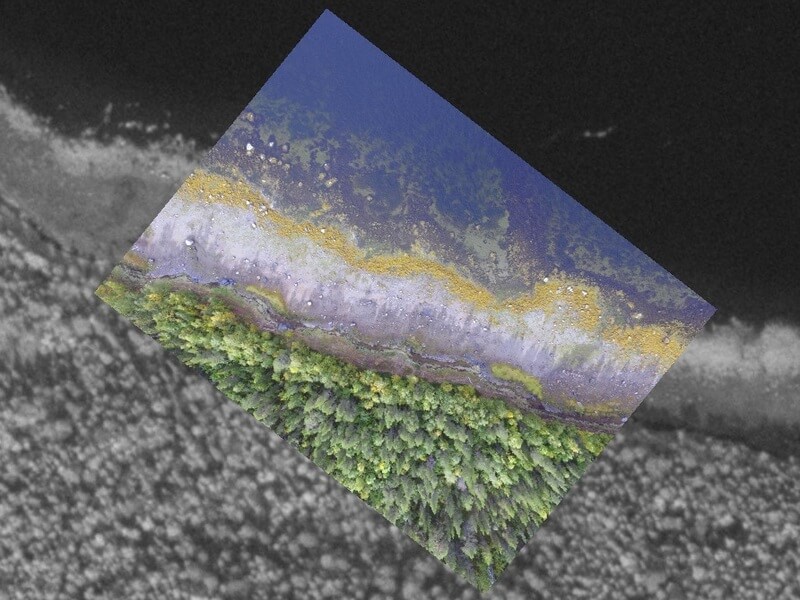
When taking aerial photographs from UAVs equipped with cameras with a fixed focal length, GSD depends on the altitude of capturing. If the GSD of the satellite is constant, since the altitude of capturing is unchanged, then the flight altitude of the UAV can be changed within the technical characteristics of the device. The flight altitude parameter, in serial aerial photography, is determined by the safety of work and the spatial resolution necessary to complete the task for which aerial photography is performed. For example, aerial photography of the White Sea coastal strip, carried out in 2017, was made for geomorphological mapping of the littoral zone, geological description of the littoral and upper sublittoral zone, estimation of the amount of algae emissions, and mapping plant communities in the littoral zone and in the upper part of the sublittoral zone. To accomplish these tasks, the survey was carried out from a altitude of 60 m. To compare the GSD of satellite imagery and UAV imagery, a part of the WorldView-2 satellite panchromatic imagery frame and the Geoscan 401 UAV image were spatially aligned (Pic. 4).
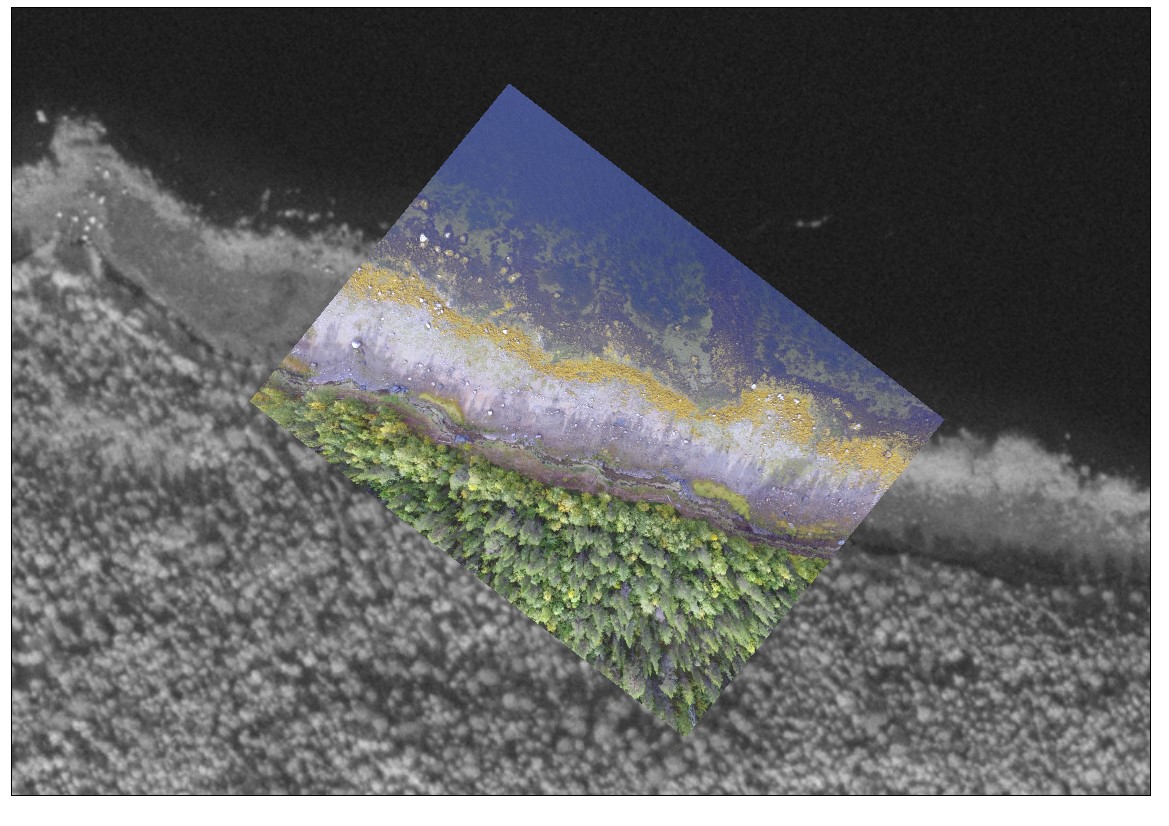
Рic. 4. Spatial alignment of a part of the frame of the panchromatic imagery of the WorldView-2 satellite (monochrome image) with a resolution of 46 * 46 cm, and an image of the Geoscan 401 UAV with a resolution of 1 * 1 cm (color image).
b. Coverage
The area of the satellite imagery frame is determined by the width of the survey strip. The World View-3 apparatus has a survey swath width of 13.1 km, the World View-2 apparatus has a width of 16.4 km. Moreover, due to the use of long-focus lenses, distortion over the entire area of the frame is minimal. Distortion and GSD can still depend on the shooting angle, and they are minimal when shooting in nadir (straight down, perpendicular to the ground).
The coverage of aerial photography by UAV is determined by the UAV type, the preset GSD and focal length of the lens, as well as the distance of place of interest from the launch site. In our case, we used the Geoscan 401 quadcopter which technical characteristics are given in Table 2 while its photo is presented in Picture 5. As an experiment, 200 ha of the coastline was captured. Areal aerial photography with the help of quadcopters is the implementation of a continuous series of images with UAV flying on tacks over a preset territory. The images have a large overlap (as a rule, frontlap = 70%, sidelap = 50%) to eliminate distortion. Further processing is carried out in specialized programs such as Agisoft Metashape. Image overlap is calculated automatically depending on the flight altitude. During one 60-minute flight at the altitude of 60 m on one battery, Geoscan 401 can take approximately 250 images, which, during processing, will cover about 50 ha. If several charged batteries are available, the operator can capture the entire territory, within the range of radio communication with the quadcopter.
| Flight time | up to 60 min |
| Max route length | 15 km |
| Coverage in one flight | up to 50 ha |
| Max. wind resistance | up to 10 m/s |
| Flight speed | 0-50 km/h |
| Max take-off weight | 9,5 kg |
| Max payload weight | 2 kg |
| Dimensions folded | 71*20*19 cm |
| Motors | electric |
| Dimensions during flight | 156*156*56 cm |
| Min safe flight altitude | 10 m |
| Max flight altitude | 500 m |
| Take-off preparation time | 5 min |
| Temperature | -20 to +40 °С (extension -40 to +40 °С is possible) |
| Take-off/landing | vertical, automatic, from 5*5 m launch site |
Table 2. Geoscan-401 characteristics
Pic. 5. Geoscan 401
c. Frequency
Spacecrafts for highly detailed imaging revolve around the Earth in their orbits, which shift on each orbit to cover the entire area of the earth's surface. Therefore, each satellite has characteristics such as an orbital period and a recapture time. For the World View-3 apparatus, these characteristics are set in such a way that the satellite can capture the same place in 1 day, flying around the entire Earth during this time and capturing its entire surface with a revolution period of 97 minutes. Depending on the inclination of the orbit of the satellites, the time between re-shooting one point on the earth's surface at different latitudes may vary. Satellite imagery of the Arctic regions in the optical spectrum is limited by the time of year. No images are taken during the polar night. For example, in the area surrounding the White Sea Biological Station of Moscow State University, where mapping the sea coast is carried out, there is no absolute darkness throughout the day even in winter. Although the biological station is located in the Arctic Circle, in winter there is sufficient lighting for several hours a day for aerial photography. But high-resolution satellite imagery for this region can only be obtained from February to the end of November. For regions located to the north, this period is even shorter. There is another factor to consider when working with satellite imagery. Most of the satellites intended for remote sensing are launched into sun-synchronous orbits. This means that pictures of the same place will always be taken at the same time of day. For example, the World View-2 apparatus flies over the surroundings of the White Sea Biological Station of Moscow State University always in the daytime, around 12.40-13.00.
Aerial photography with the help of a UAV can be carried out at any time with any frequency, with only limits due to the conditions that ensure the safety of work.
d. Promptness
The term for obtaining satellite images for any territory is determined by the time of flight of the satellite over the place of interest and the speed of information exchange between the customer of the survey and the pilot. For example, in the Arctic regions, you can wait an image for 1 to 4 days in a limited time interval with a tight reference to the presence of cloudiness.
The efficiency of surveying with a UAV is determined by the remoteness of the survey area from the location of the pilot with the vehicle and the transport accessibility of the survey area.
e. Weather conditions influence
Cloudiness affects the possibility of obtaining high-quality satellite images. Satellite images have a "cloud coverage percentage" parameter, which is specified along with the main image parameters. The larger the percentage of cloud coverage, the smaller the image area available for study and processing. If an area of interest is overcast, obtaining high-quality images may be delayed indefinitely, until clear weather sets in.
UAV operation is possible both in clear and cloudy weather. It is impossible to work in rain, fog, snowfall and strong wind (more than 10 m/s). It is also difficult to work at temperatures below -40 ° C.
f. Special characteristics
High-resolution satellite images are taken in the multispectral range. The main capturing bands common to all high-resolution satellites are 4 spectral bands (blue, green, red and NIR). There is also a panchromatic band. The satellites of the latest models are equipped with capturing equipment operating in the middle and far infrared spectrum. Spectral band ranges may vary slightly for different satellite models.
A feature that characterizes almost all orbital imaging equipment is the beginning of the blue spectrum band. It starts at 450 nm, which is the very end of the blue spectrum. This is because the Earth's atmosphere scatters blue light, and very little reflected blue light returns to orbit. However, the latest models, such as World View-2 and World View-3, have very sensitive capturing equipment capable of capturing blue light scattered by the atmosphere. Therefore, an experimental sensor, the so-called “Coastal”, which perceives the violet and blue spectrum, starting from 400 nm, is installed on these devices. The presence of this band makes it possible to distinguish objects in the clear water of the tropical zone at depths of several tens of meters. In Arctic regions, cold sea water is oxygenated and rich in plankton. A large amount of suspension makes it opaque, so blue light, which penetrates the deepest under water, is intensely absorbed, and a small amount of it, reflected from underwater objects, is scattered by the atmosphere.
The GSD of the spectral bands of high-resolution satellites starts from 1.24 m. Such a GSD does not allow the geomorphological and geological characteristics of the coastal strip to be produced in a color image, but it makes it possible to distinguish plant communities of plant species growing in dense groups, to identify the pattern of surface water runoff in the coastal strip and on the littoral zone. To increase the GSD, a panchromatic band, which combines the entire visible spectrum, is used and has a GSD of 31 cm. Using the procedure for merging spectral and panchromatic bands, which is performed in special software, you can get a more detailed color image of the area, which will allow you to reliably distinguish individual objects in the image, for example, stones, from half a meter in size, but for geomorphological, geological and biogeocenological describing it is still not enough.
Images taken by UAVs, equipped with standard cameras, are in color and in the visible spectrum. They are suitable for detailed descriptions of the terrain, since it is possible to change the GSD over a wide range. In these images, all plant communities are clearly distinguishable, even those plant species that grow in small groups, such as, for example, some types of halophilic vegetation in the littoral zone. Color aerial photographs make it possible to characterize the mechanical composition of the soil (silts, sand, gravel, stones, boulders and rocks). UAVs can also be equipped with multispectral cameras, the quality of images will be better than satellite ones due to the high resolution and the absence or small influence of atmospheric distortions.
g. Shallow water accuracy and depth
In the Arctic seas, high-resolution multispectral satellite images make it possible to observe large concentrations of marine vegetation at a depth of up to 1 m. At low tide, it is possible to reliably distinguish such objects as thickets of sea grass zostera (Zostera marina), borders of the belt of brown algae fucus (Fucus vesiculosus, Fucus serratus), upper border of thickets of brown algae laminaria (Laminaria saccharina). Objects at depths greater than 1 m in the Arctic seas are not distinguishable due to the absorption of light by water and the scattering of the blue spectrum in the atmosphere.
Unlike satellites, the UAV flies tens of meters from the earth's surface. Therefore, the influence of the atmosphere on the quality of the image is absent. In UAV images, you can distinguish objects at a depth where visible light penetrates. Due to the large amount of suspended matter, the water in the Arctic seas is transparent at a distance of only a few meters. In summer, in the coastal strip of the White Sea, visibility under water is limited to 7-10 m. But even such visibility makes it possible to reliably distinguish objects at a depth of up to 5-6 m (Pic. 6).
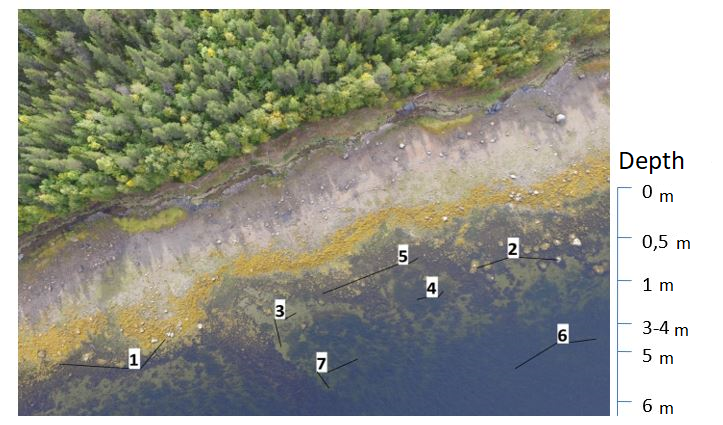
Pic. 6. Some underwater objects, clearly visible in the image taken by Geoscan 401 at the altitude of 50 m at low tide.
Objects that can be distinguished:
1 — landforms, such as a boulder belt at the lower limit of the littoral zone, covered with thickets of brown algae fucus (Fucus vesiculosus, Fucus serratus), depth 0–1 m;
2 — separate stones and rocky ridges, depth 0–1.5 m;
3 — sandbed, depth 1–3 m;
4 — accumulations of filamentous algae (Cladophora sp., Rhizocloniumsp. etc), depth 1–2 m;
5 — thickets of brown algae chorda (Chorda filum), depth 0.5–1.5 m;
6 — thickets of brown algae laminaria (Laminaria saccharina), depth 3–5 m;
7 — thickets of sea grass zostera (Zostera marina), depth 1–3 m.
h. Ability to track changes. Monitoring
High-resolution satellite images are traditionally used to track changes on the Earth's surface, both in natural and anthropogenic landscapes. For instance, monitoring of natural communities of the coastal strip, changes in the contour of the coastline, changes in the area of marine mammal rookeries in the Arctic, assessment of the impact on the coastal strip of the construction of pipelines and coastal infrastructure during the exploration, production and transportation of minerals. All these data can be collected using satellite images promptly and constantly throughout the entire area of the Arctic coast, taking into account the weather conditions and the schedule of satellites flying over the monitored object. At the same time, tasks solved with the help of satellites should not go beyond the capabilities of deciphering an image with 31 cm GSD or more.
Monitoring with the Geoscan UAV can be carried out at a very detailed level. For example, tracking changes in the coastline can be carried out at the level of observations of the movements of individual stones and other small objects. However, the area covered by monitoring is limited by the range of the UAV and the mobility of the flight support team. Monitoring of distant objects with the help of a UAV is possible only if the operator with the device is delivered to the place of work. Annual aerial photography of the monitored object can be carried out at the same time and from the same point, since the route and coordinates of survey points are stored using the UAV software.
i. Vectorization of data and the possibility of application in GIS
Multispectral satellite images are provided to the user as a set of files in the GEOTIFF format. Each file contains a georeferenced image taken in one of the spectral bands. Also, there are text files with various information, including those about the date, time of capturing and receipt by the pilot of each image, geographic coordinates of the corners of the captured polygon on the Earth's surface in the UTM WGS-84 coordinate system, satellite camera tilt angle, as well as data of primary image processing agreed with the customer. The accuracy of image binding is from 3 m or more. All these data make it possible to work with the image in specialized software for creating an orthomosaics using a digital terrain model and subsequent interpretation, combining spectral bands, compiling image mosaics and vectorizing raster images. Raster images prepared in specialized software, their fragments and vector data are further used as layers in geographic information systems (GIS) to create detailed terrain maps, 3D models, and conduct thematic and mathematical analysis of terrain objects. Combinations of spectral bands allow you to visually highlight different classes of objects, which facilitates their vectorization.
Aerial photography using the Geoscan 401 UAV was carried out in nadir, and the obtained RGB-images were in RAW format and had georeferencing of capturing centers with an accuracy of 10 cm in the WGS-84 coordinate system. These images in the form of a geographically referenced raster image can be used in geographic information systems as a separate layer for vectorization and data analysis.
j. Software and equipment
When working with coastal areas, you can meet with steep and high steep slopes, sheer cliffs. Some Arctic islands have sheer cliffs hundreds of meters high. To avoid distortions associated with the relief, there is a procedure of orthophoto correction, when a satellite image is superimposed on a digital elevation model (DEM). There is an international database with the DEM of the whole Earth, from where you can get data on the required area and process the image. Also, to build a local high-resolution terrain map, there is a stereo shooting procedure, when two successive images of the same polygon are received from the satellite, taken at different angles. By combining these images, a three-dimensional image of the terrain is built, which can be used to create a local digital elevation model and obtain a height map. After orthomosaic correction, the satellite image is ready for interpretation and further processing. These days, the most popular software programs for working with satellite images are ERDAS IMAGINE and ScanEx IMAGE Processor. These are professional licensed programs for the full cycle of remote sensing data processing. Satellite images prepared and processed in these programs are used in geoinformation and navigation systems. To process satellite images, modern computers with large RAM and a high clock speed of the processor are required, since the images are large.
Geoscan UAVs are equipped with Sony Cyber-shot DSC-RX1 cameras with central projection. Cameras can be installed both in nadir and in perspective, depending on the tasks. The processing of aerial survey data was carried out in the specialized software Agisoft Metashape, which was used to build digital terrain and relief models, orthomosaics and a textured 3D model of the coastline (Pic. 7, 8).
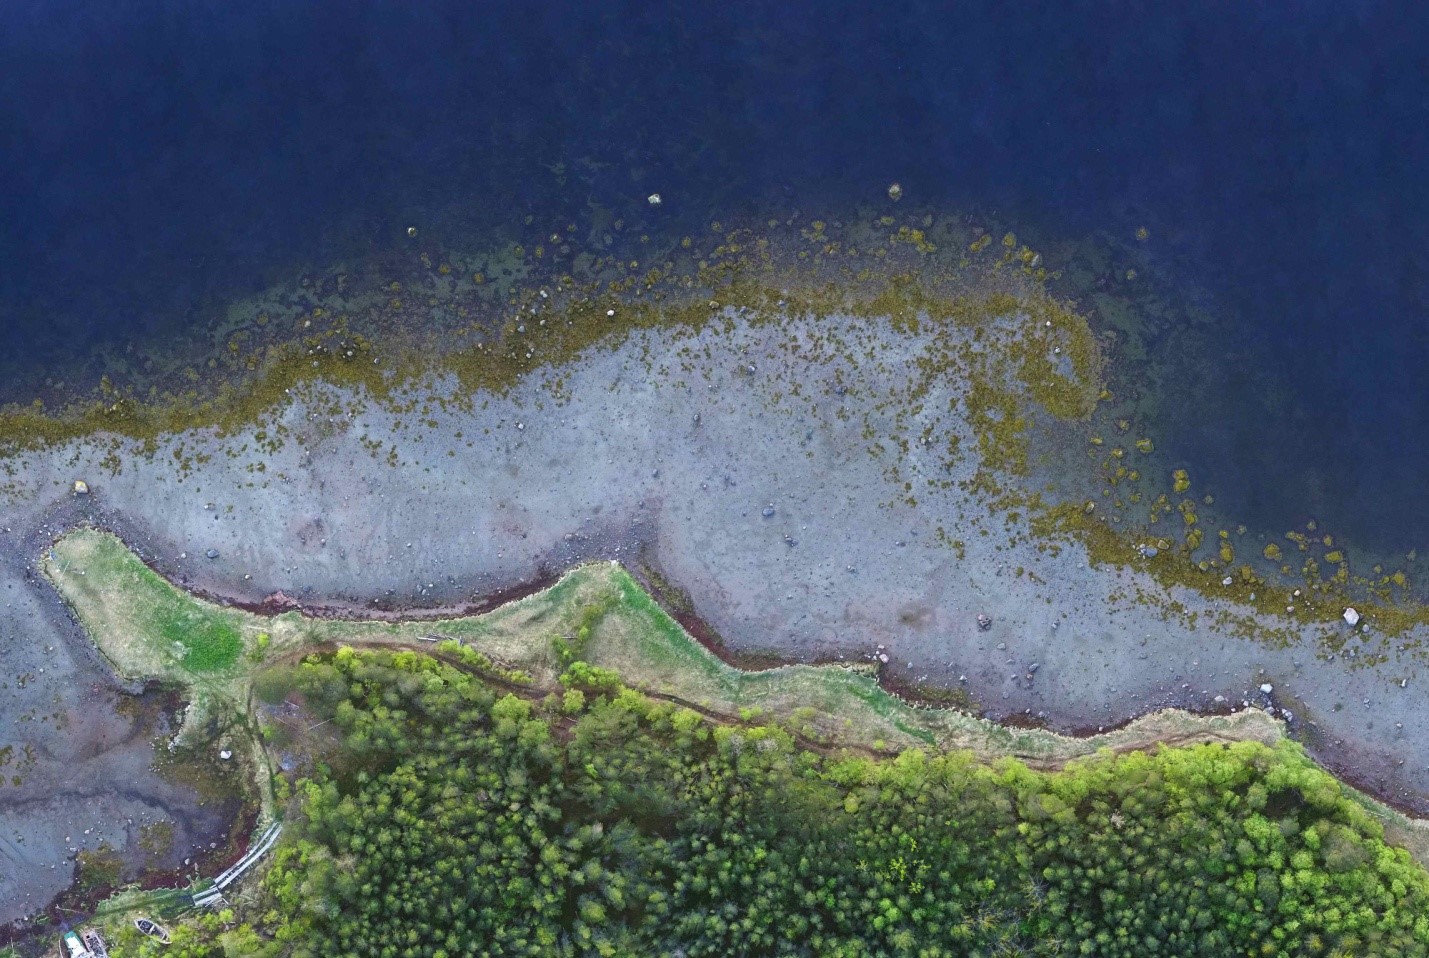
Рic. 7. A fragment of an orthomosaic of the coastal strip taken at low tide.
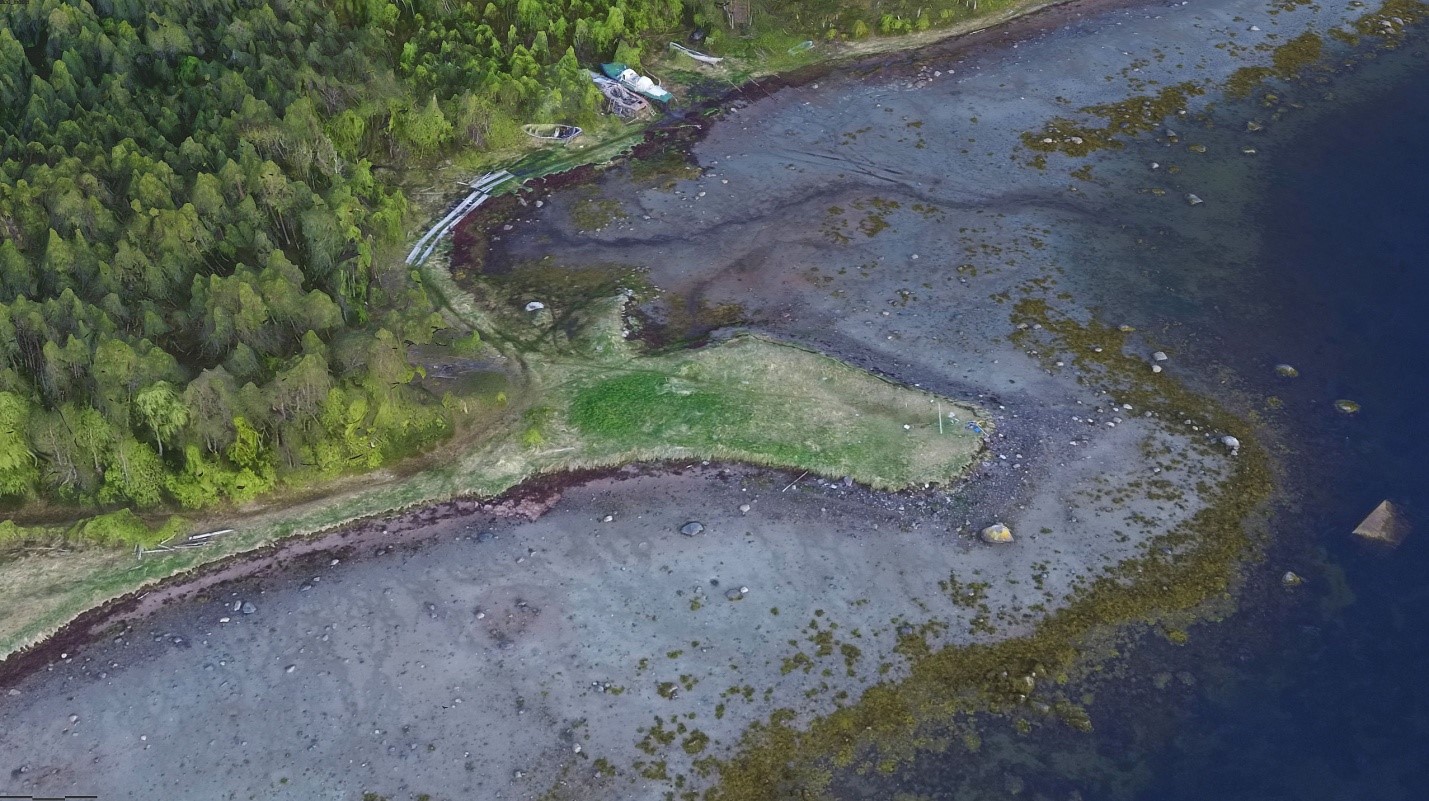
Рic. 8. Fragment of a textured 3D model of the coastal strip, taken at low tide.
Subsequently, the height map and the orthomosaic were loaded into the GIS as separate layers for processing, measuring distances, areas, etc. To work with the Agisoft Metashape program, a high processor frequency and large RAM are required, since a large number of images is processed simultaneously.
To carry out aerial photography using the Geoscan 401 UAV, a ground control station (GCS) was used with a pre-installed flight control and design program Geoscan Planner. Also, GCS includes a radio modem for monitoring and controlling the UAV. This equipment and software allows the pilot to prepare a project with specified aerial photography parameters and conduct aerial photography in an automated mode with telemetry control and the possibility of changing parameters in the process. Moreover, this product allows you to later view log files and analyze the work done.
4. Perspectives
The need to collect and constantly update detailed maps of sea coasts in the Arctic requires constant costs for obtaining and processing high-resolution satellite imagery. Monitoring objects can be located in remote regions, but they have a permanent deployment. This facilitates the possibility of using aerial photography with UAVs. For the geomorphological, geological, geobotanical description of sea coasts and a narrow coastal strip with a littoral zone, very high resolution aerial photography is required. The description of the upper sublittoral zone to a depth of several meters is necessary for complex studies. Such descriptions using remote methods are possible only on the basis of aerial photographs taken with the help of UAVs. Having at your disposal a standard kit, which includes a UAV, several additional batteries, a satellite, a computer for data processing, the necessary software and delivery vehicles for a mobile flight support team, it is possible during the summer season to prepare very high-resolution aerial photographs for analysis over hundreds of kilometers of sea coast. Or to provide continuous monitoring of the coastal strip, independent of the presence of clouds, within the range of the mobile flight support team.
Prospects for the use of UAVs for aerial photography are associated with the development of software for processing and decoding the footage, the possibility of using specialized capturing equipment operating in various ranges, including infrared.
5. Conclusions
Comprehensive studies of the nearshore with modern methods have seen an increasing need in mapping with UAVs (in particular, the Geoscan 401 system has proven itself well). The possibilities that only this method provides have already been identified. For example, the possibility of mapping objects in coastal shallow waters to a depth of 5-6 m.
The combined use of Earth observation and aerial photography significantly expands the possibilities of both methods. For example, when deciphering natural communities in the littoral zone, it is possible with the help of aerial photography to quickly and accurately identify and vectorize practically all objects a few centimeters across on a multi-kilometer coastline. The high resolution of aerial photographs makes it possible to very accurately vectorize reference polygons for automatic satellite image classification and other methods of its mathematical processing.
Literature
1. Schukin I.S. Quadrilingual encyclopedic dictionary of terms in physical geography. M.: Sov. Encyclopedia, 1980. 704 p.
2. Ignatov E.I. Coastal morphosystems. Smolensk: Magenta. 2004. 362 p.
3. Burkovsky I.V. Marine biogeocenology. Organization of communities and ecosystems. M.: T-in scientific publications of KMK. 2006. 285 p.
4. Romanenko F. A., Repkina T. Yu., Efimova L. E., Bulochnikova A. S. Dynamics of ice cover and features of ice transport of sedimentary material on tidal drylands of the Kandalaksha Bay of the White Sea // Oceanology. 2012. V. 52. No. 5. S. 768–779.
5. © Company Sovzond, "Space imaging of the Earth with high and ultra-high resolution", 2017. [On the Internet]. Available: https://sovzond.ru/products/spatial-data/satellites/#sat-425. [Access date: 11 November 2017].
6. © 2018 Agisoft. [On the Internet]. Available: https://www.agisoft.com/buy/online-store/. [Access date: 14 March 2018].
