Given the pandemic environment, not every subsoil user is ready to organize large-scale on-the-ground geophysical works. This is due to both the uncertainty in the future cost of resources and the risk of disruption due to COVID-19. At the same time, we would like to cover large areas with surveys, so as to obtain the data and plan the works for the next field season. One solution is to apply geophysical survey methods using UAVs (Unmanned Aerial Vehicles). Implementing this type of research minimizes staff requirements (a team of two people or more) and does not require much time to complete the works. The latter factor is not insignificant, taking into account the mandatory observation of the field team for signs of infection.
Gold prospecting and exploration has always been a highly relevant issue. The richest commercial ores belong to LS-type epithermal deposits with predominance of quartz-vein mineralization (Hedenquist et al., 2000). These ores are particularly attractive due to high concentration of gold and the fact that the metal is in free form (easily recoverable). Most of the large and medium-sized LS-epithermal deposits are concentrated in the Russian Far East. The southern part of Kamchatka has a relatively well-developed infrastructure and discovering a deposit in this part of the region is very promising.
The author tasked himself with processing and interpreting the magnetic survey data obtained by UAV in the Asachinskiy area (south of the Kamchatka Peninsula). The purpose of the studies was to localize areas that look promising for the presence of gold-silver LS-epithermal quartz veins.
Methodology
The UAV magnetic survey works were performed using the Geoscan Geophysics system. Within 8 working days, an area of 31 sq. km was covered, with a distance of 50 meters between the flight lines. The survey was performed using the terrain-following technique. An aerial photography of the area was taken beforehand using an unmanned aerial vehicle. This made it possible to maintain the flight altitude of 40 meters as accurately as possible. Two employees of the Geoscan Group (1 geophysical engineer and 1 worker) took part in the field works. An overview of the equipment is shown in Figure 1. More information about the equipment can be found on the websites of Geoscan Group and GM-Service Ltd. geophysical service company. The main advantages of the system and the magnetometer used are the following properties: the total deviation error does not exceed 0.3 nTl; the measurement frequency is 1000 Hz. During one flight, the drone, equipped with a magnetometer, covers 15 to 20 km (at an average speed of 10 meters per second and with an overlap of 400 to 500 meters per kilometer). Importantly, the magnetometer is attached to a cable hanging 20 meters below the quadcopter. This effectively eliminates measurement errors associated with UAV influence (Senchina et al., 2020).

Figure 1. Unmanned aerial vehicle – Geoscan 401 quadcopter and Geoscan Geoshark quantum magnetometer.
The data was processed by the staff of GM-Service Ltd. geophysical service company over three business days, using in-house software product “MagGM”. According to a comparison of the field values at the intersection points of series and secant routes the RMS (root mean square deviation) was 2.3 nTl. The anomalous magnetic field map, the vertical derivative map, and the total horizontal gradient map are shown in Figure 2. It should be noted that the maps in Figure 2 are presented without any smoothing procedures. Only the registration of geomagnetic field variations, normalization to reference flights and accounting of the Earth’s normal field were performed. The measurements along the flight lines were not sparse (the step along the flight line is 1 meter). The smoothness of the result (especially the vertical magnetic field derivative maps) and low RMS values indicate high data quality.

Figure 2. Results of UAV aeromagnetic survey data processing. Left – map of the anomalous magnetic field; center – map of the vertical derivative of the anomalous magnetic field; right – map of the total horizontal gradient of the anomalous magnetic field.
After processing the data, the author performed their geological interpretation. The work at this stage can be divided into several stages, which were carried out in parallel:
- Qualitative interpretation – lineament analysis of the anomalous magnetic field map and its various transformations (Fernandez-Popova et al., 2020);
- Quantitative interpretation within 3D models using 2 algorithms: Median Tomo program (Shtokalenko et al., 2014) and ZondGM3D three-dimensional inversion program (ZondSoftware.com);
At each stage, the author compared the results with the features of the geological structure (geological map).
Results
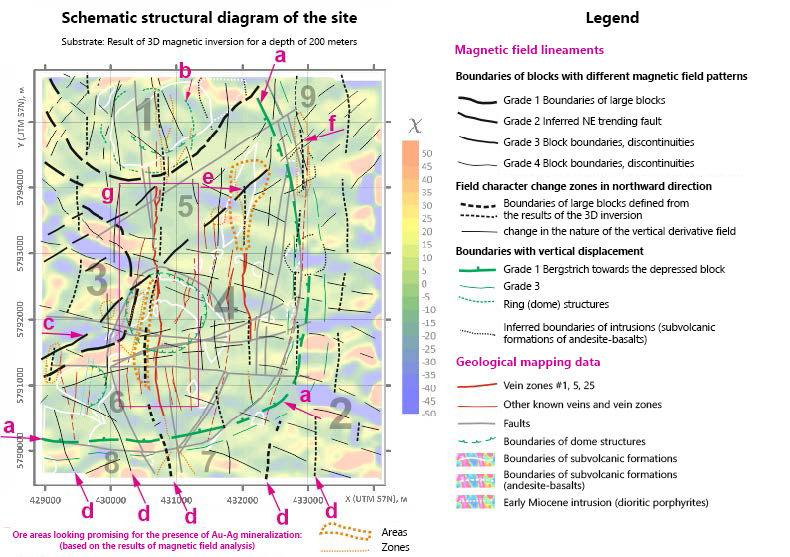
The result of the interpretation was a schematic structural diagram of the site shown in Figure 3. To show the structural features, the author plotted the magnetic field lineaments on the map of effective magnetization values (the result of 3D data inversion) at a depth of 200 m. The plot is divided into blocks and the blocks are numbered for ease of description.

Figure 3. Schematic structural diagram of the site, combined with the main features of the geological mapping. Latin letters a-g show the main structural features. Outline “g” is the vein zone #1 and its northern extension – vein zone #5.
Several features can be identified in Figure 3:
Feature “a” indicates a zone with vertical displacement. Blocks 1, 5, 3, 4, 6 may have been raised at some point in geological history and then lowered. Subvolcanic andesite-basalt formations are concentrated along the “a” boundary only on the geological map. The andesite-basalts can probably be dated to the age of this concentric fault zone with vertical displacement.
Feature “b” is a concentric structure at the north of the site. Three dome structures are marked on the geological map. Only the northern dome structure is reflected in the magnetic field.
Feature “c” is a pronounced zone of NE extension. This specific zone is covered with loose sediments and is not shown on the geological map. Given that the veins are “swollen” in the NE direction, this zone may have an important ore-controlling role.
Feature “d” – zones of meridional spreading. These zones, presumably contact areas between blocks, or faults, coincide with the vein spreading, and at times coincide with the actual vein bodies (zone #25, located in the center of block 4) or run parallel to vein zones. We recommend prioritizing these meridional zones for further geologic exploration activities. The main recommendation is to look for strong blocks that intersect these meridional zones. The use of ground-based gravimetric survey seems to be the most optimal method. The Bouguer anomaly can be used to determine the position of a dense block; if it intersects a zone of meridional spreading, then this area should be considered as the most promising. An epithermal deposit was found in Japan in a similar manner (Craig et al., 1998). In the case of the above deposit, the results of the ground gravity survey revealed a strong block in the basement. With a little drilling, a large epithermal deposit was discovered that was close in age to the properties of the Asachinskiy site.
Feature “e” is the intersection between a “meridional spreading zone” and NE-extended zone “c”. If guided by the main structural criteria from the stock materials for this area (intersection of meridional and NE-directional faults), area “c” seems to be one of the most promising locations. Within such local areas the subsoil user can take risks and immediately perform drilling operations. Unfortunately, the object of exploration – a thin vein (with the thickness varying from several decimeters to meters) is often overlapped and it is extremely difficult to detect using drilling. Surface geophysical methods, geoelectrochemistry, and lithogeochemical searches for secondary dispersion halos can help reduce risks and efficiently design drill holes (Putikov et al., 2017, 2019; Senchina, 2020; Sokolova et al., 2019). The research team in (Ermolin et al., 2018) demonstrated how LS-epithermal deposits are manifested in geophysical fields and what methods may be effective for detailed work when the vein zone is overlain by a 120-meter thick volcanic sequence.
Feature “f” – if we start investigating the meridional zones located east of vein #25, we should probably start in the vicinity of area “f”, since in this area the NE-trending fault zone (feature “c”) intersects the contact area between blocks of different magnetic susceptibility of meridional strike.
Feature “g”. There are two meridional zones parallel to vein No.1 to the west, detected by the change in the nature of the magnetic field.
Conclusion
Within a short time (8 working days), a team of 2 persons performed works using magnetic survey method with application of UAV on an area of 30 sq. km. Data processing was completed within 3 working days. A schematic structural map of the area was drawn as a result of a comprehensive interpretation of the magnetic survey data and available geological and geophysical information. The most promising areas for the presence of Au-Ag mineralization were determined by structural criteria. Recommendations on the direction of further exploration work were given.
Source: “Engineering and Ore Geophysics 2021” – Gelendzhik, Russia, April 26-30, 2021
E.YU. Ermolin* (GM-Service Ltd. geophysical service company)
